

Due to the fruitful cooperation of CloudLinux kernel distribution and cPanel control panel, users on our shared hositng servers get a fair share of resources, since the system takes control over the resources allowed for use in each account. It is a more secure and stable way to keep shared hosting, since a single user, who abuses resources, cannot influence the whole server and other users in particular. You can additionally check resources allocation according to the package in our Acceptable Use Policy.
In order to get good web site performance, we provide tools for resources monitoring. When accessing cPanel you can see 'Stats' bar on the left. We are going to explain some of the values from this bar.
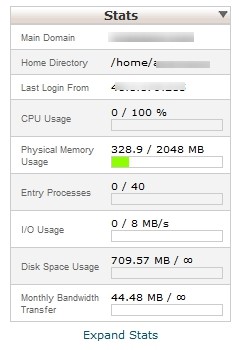
CPU Usage / lvecpu
Each shared hosting package is allowed to use certain amount of CPU in percentage and consuming more than that will cause web site poor performance. If account consumes more than 100% of CPU allocated to it, all new processes will be put to sleep, until the queue is cleared. In case of multiple CPU faults you should optimize scripts and heavy plugins, as well as database queries; check for excessive cron jobs; make sure the search engine robots do not check your web-site too often; and install caching plugins. Otherwise, check shared hosting upgrade options or regard VPS packages for more CPU resources.
Physical Memory Usage
You can check how much RAM in Megabytes the processes in your account are using at the moment. Each loadable page, script or activated PHP module consumes certain amount of memory. If your account hits the limit, the web site poor performance is guaranteed. You will see the following error in log file (if error logging is on): 'Cannot allocate memory: couldn't create child process'. This error may give you a hint of what script causes OOM (Out of Memory).
Entry Processes
This value counts processes that enter your account. Each PHP page, cron job or SSH session generates an entry process. Usually it is a challenge to create up to 40 entry processes at the same moment. Even if several simultaneous visitors open your web site page, these processes end fast. Should the limit be hit, new processes will be denied until the queue is clear.
Number of Processes
This values means pretty much the same as the above mentioned, but it counts the total number of processes within LVE (shared hosting environment), rather than entry PHP processes. In most cases this value remains low, cause non-PHP processes live just a fraction of a second.
I/O Usage
The value in Megabytes per second shows the time needed to complete input/output disk tasks in the account (cache isn't calculated in this case).
inodes / lvequota
Each file, folder or mail produces a separate inode that includes information on this file system unit. File system itself imposes such limits. When account consumes great deal more resources than supposed to, there won't be any possibility to create new files, and the web site, mail and other services on the account will be affected, with the further service interruption. To keep the account within the allowed amount of inodes, we recommend restructuring the content in the account, deleting excessive files and emails.
Monthly Bandwidth Transfer
Here you can see the amount of data in Gigabytes flowing between your web site and visitors. When a user requests a web site page with several media files, the amount of the used traffic would be a sum of a page and media files. Multiple this figure on the visitors per month, and you'll get monthly bandwidth transfer value. This number is given for information only, since we provide unlimited bandwidth for shared hosting accounts.
More detailed statistics is given in 'Logs' > 'Resource Usage' section in cPanel.
We would like to point out, that we provide soft limits in most cases. This allows our customers to respond in time and take measures to optimize their accounta or upgrade to a higher shared hosting package or a VPS. Please get in touch with us whenever you need our assistance. We are online 24/7 for you.